A deterministic model for forecasting long-term solar activity
This page is a general summary of my work on modelling the evolution of solar cycles. The relevant article is published in the Journal of Atmospheric and Solar-Terrestrial Physics.An older longer version is found on arXiv, and a presentation for the International Astronomical Union is online here.
UPDATE: I have added my predictions for solar cycle 25, also posted on the arXiv, and sent to the NOAA/NASA Prediction Panel.
JUNE'21: An expansion of this work is now published in Advances in Space Research. It includes the inner planets and shows the relation of their motion to individual solar flares.
Solar events have long been known to follow a cyclic behaviour, repeating approximately every 11 years; this includes sunspots, solar flares and other eruptive events, and in turn terrestrial effects - e.g. the nothern lights, with their years of maximum and minimum activity.
It is evident that the source of this periodic behaviour lies in the Sun's magnetic fields and that the effects are brought about by its magnetic dynamo mechanism. However, the cycles are quite irregular in both duration and evolution. Moreover, there is no solid explanation for this variability, let alone a way to know what the next cycle's evolution will be.
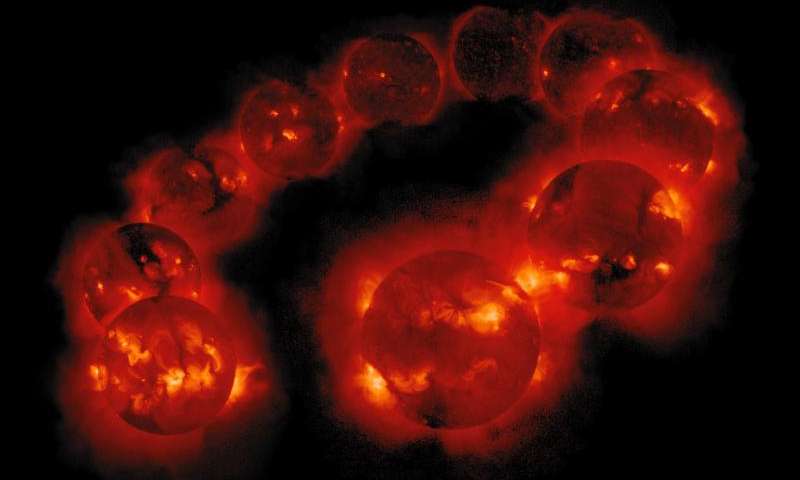
Image credit: Yohkoh Soft X-ray Telescope
Here a model is proposed for describing and predicting solar cycles in terms of solar flares activity. One of its main elements will be the relative motion of the planets Jupiter and Saturn. Let's point out that since the "common period" of these planets, the so-called synodic period, is close to 22 years, their possible role had already been suggested in the past. However, only few previous such works look at solar data analytically, and those mostly deal with sunspots, which are indicators of the magnetic activity but not actual events. (The advantage of sunspots is that their continuous records span four centuries. It could be that after being able to record solar flares for forty years, the time is just right for us to also see what they say!)
---
STARTING REMARKS
The data used are all M and X-class solar flares in years 1977-2017 incl., from the SMS and GOES satellites X-ray measurements. These cover the whole of the four latest solar cycles, 21-24, with the current cycle 24 still going on.
The model is initiated by the empirical observation that solar flares during these four recorded cycles tend to gather around the dates of alignment of Jupiter and Saturn:
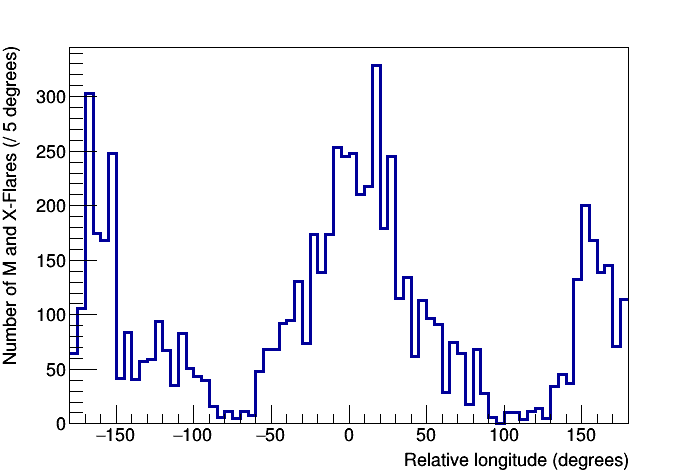
Number of flares as a function of the relative angle between Jupiter and Saturn. (angle = heliocentric ecliptic longitude)
However, as we progress from cycle 21 to 24 the peak of activity is "dragged" further away from the alignment:
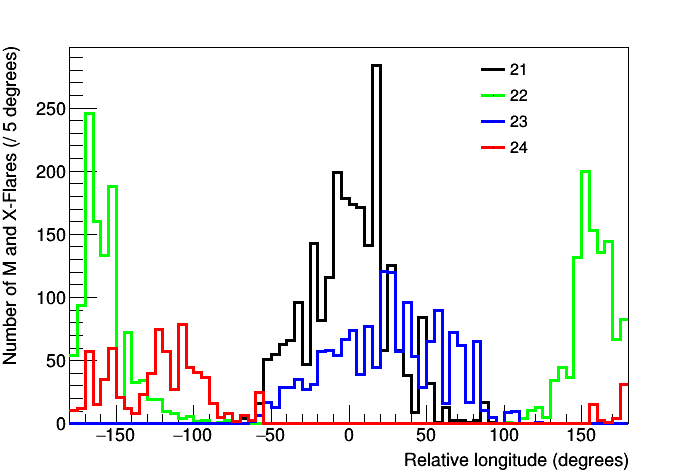
Number of flares as a function of the relative angle between Jupiter and Saturn, individually per cycle.
"With naked eye", this looks compatible with the staggering between the different lengths of the sunspot cycle (~11 years) and half of the Jupiter-Saturn synodic period (~9.9 years). So, we are led to ask whether the evolution of solar activity is a coupled effect between two temporal components: an internal, "11-year", cycle and the approach and retreat of the two giant planets.
In order to test this proposition we'll take three steps:
- Extract from the data two distributions, each corresponding to one of the two proposed components.
- Time the two distributions appropriately.
- Quantify their coupled effect.
THE MODEL
Step 1 - Extraction of the components
We will make the assumption that the "internal component" of solar activity is centered on each cycle's temporal middle and spans somewhat less than 11 years, and that the "Jupiter-Saturn component" is centered on the dates of the two planets' alignment and spans mostly -/+45o around it (as seen from the above plots). In addition, we'll assume that each component can be described by a Gaussian distribution.
Noting that in cycle 21 the dates of the temporal middle and of the alignment happened to lie close (237 days away), we'll now assume that in that cycle the full deployment of the two effects can be observed.
We can proceed to extract each distribution independently by fitting the envelope of the data of cycle 21 with the constraints described above for the Gaussians' means and deviations; the two resulting Gaussians' constants are close, and they were refitted with equal values.
Extraction of the temporal "component distributions" from cycle 21: Number of fl ares in cycle 21 centered on the cycle's temporal middle, and the fitted Gaussian functions corresponding to the internal component (left) and the Jupiter-Saturn component (right).
Step 2 - Timing of the distributions
Using the two distributions extracted from cycle 21, we'll expand over the time range of cycles 21-24. (The model was developed initially using data up to the end of year 2016, so we'll cover the time range 1977-2016.)
We do this by repeatedly centering the "internal Gaussian" on the dates of the cycles' temporal middles, and the "Jupiter-Saturn Gaussian" on the dates of the two planets' alignments. For the middle of the ongoing cycle 24 see notes at the end.
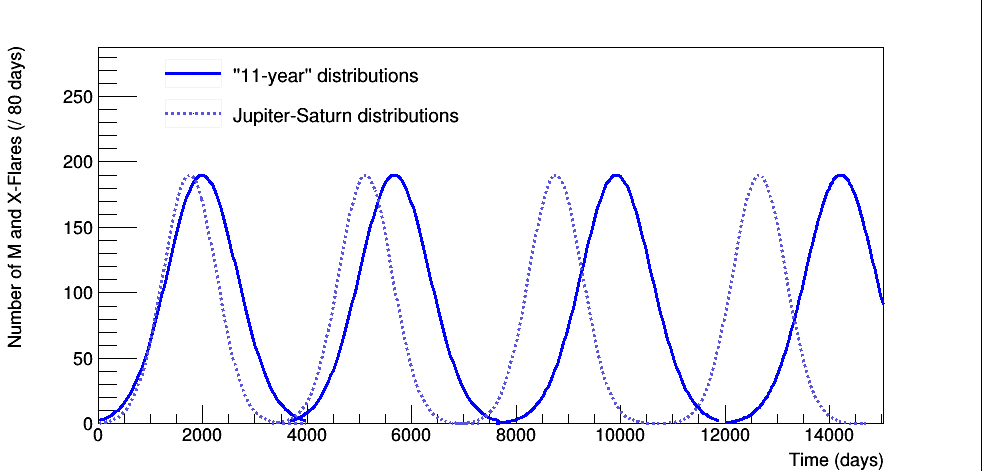
The two types of Gaussian components, centered on cycle middles and alignment dates respectively. The time range starts on 1976/06/30; the end of year 2016 is found at day 14,894.
Step 3 - Quantification of the coupling
Finally, we assume that the coupling of the two components is expressed by their common area, plotted here as a binned histogram:
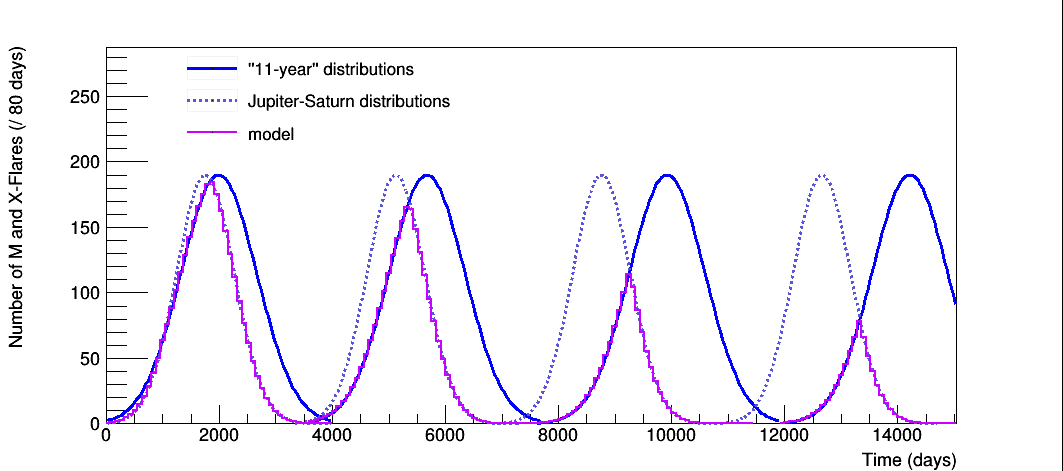
The two types of Gaussian components centered on cycle middles and alignment dates respectively, highlighting their binned overlapping areas.
This last distribution is proposed to describe the long-term solar activity in terms of M and X-flares.
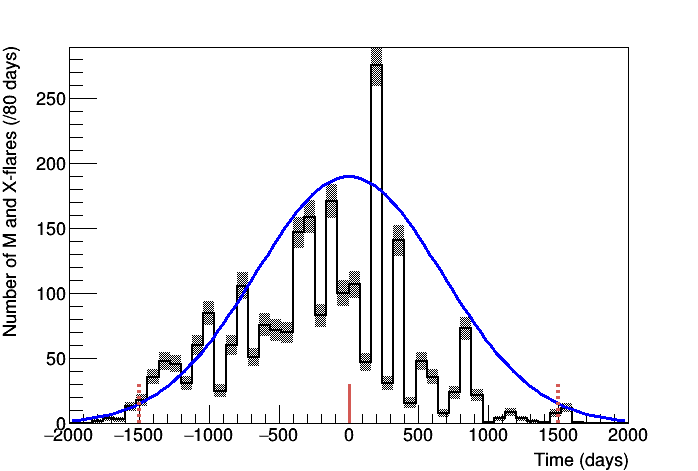
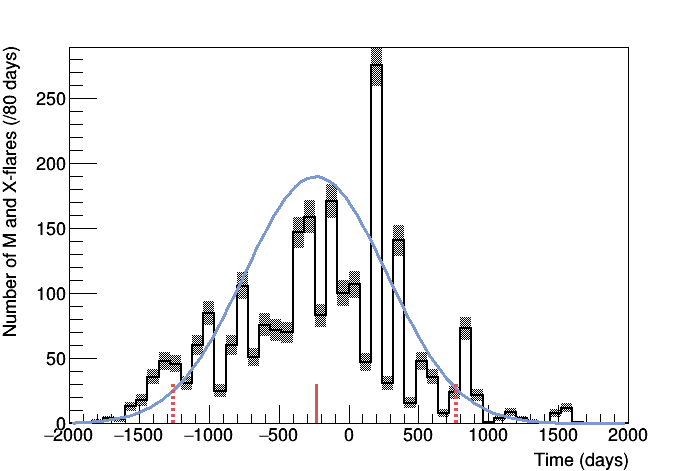
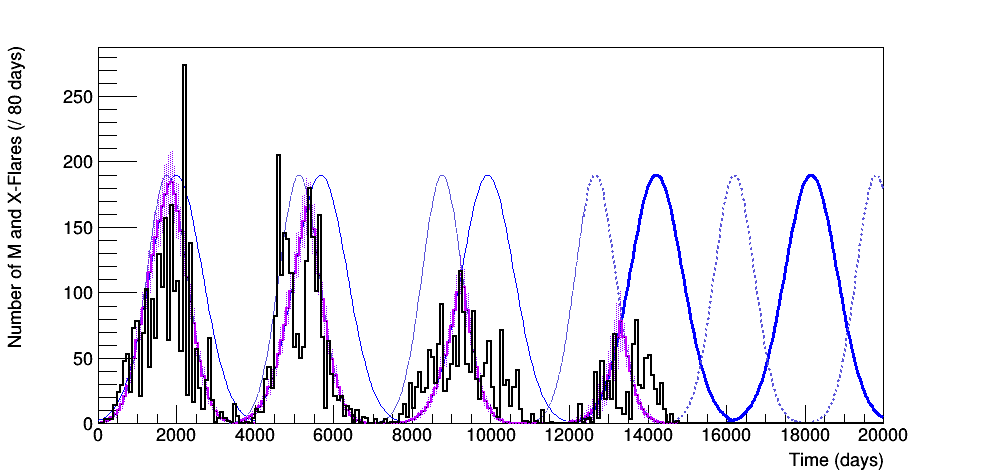
Here it is overlayed with the observational data:
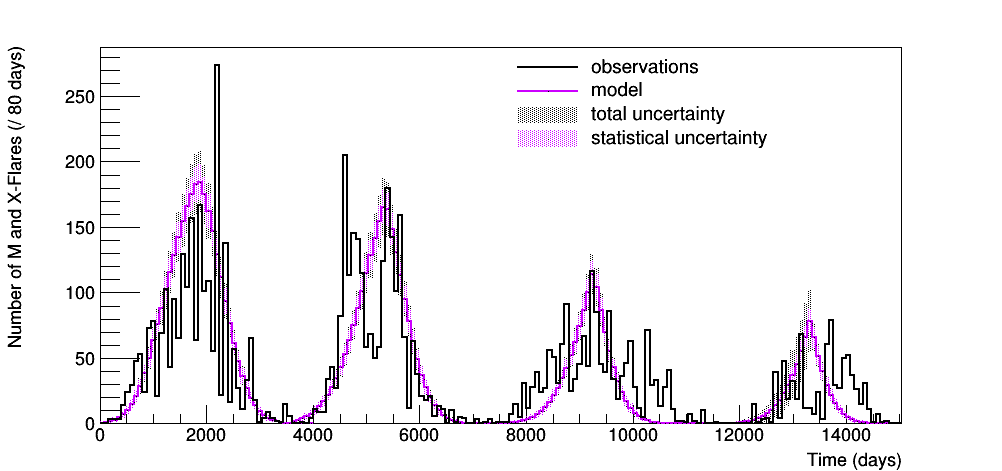
Number of flares of cycles 21-24 up to the end of year 2016, overlaid with the model distributions. (For the systematic uncertainty see notes at the end.)
Notable agreement is seen in the general features of each cycle, such as start, time span, intensity and evolution. Although there are short-scale deviations that need to be understood, the predicted distribution also contains short-scale features that are commonly considered puzzling, such as the deep minimum before cycle 24, and the abrupt decrease at the end of 2015. (At the end of 2015 the two planets retreated to a right angle, which marks the pause before a new phase of activity begins with their approach.)
PREDICTIONS
We can now expand the model over the next years, by reusing the two types of distributions. The middle of cycle 25 is estimated in the same way as for the ongoing 24 (see notes).
Observations and model predictions for cycles 21-25. The two types of Gaussian components centered on the respective dates are shown, highlighted since 2010.
The first thing to note is that during the current cycle, a second "Jupiter-Saturn Gaussian" overlaps with the "internal Gaussian". The three whole recorded cycles didn't include such a case, but it is reasonable to expect that it will lead to a new, smaller, surge of activity.
Coming to the next cycle, it is seen to begin around the summer of 2020, and be also characterized by a "double overlap". So, how the rest of 24 evolves will provide clues about 25 as well, but in any case the model points to a spread-out weak cycle, probably with two distinct peaks in activity. Finally, it can be noted that upon the actual end of cycle 24, the middle of 25 can be estimated with more accuracy.
As the model was initially developed with data up to the end of 2016 we can now include the new observations of 2017. These were compatible with the expectations from the double overlap, namely a resurgence of activity before the end of cycle 24:
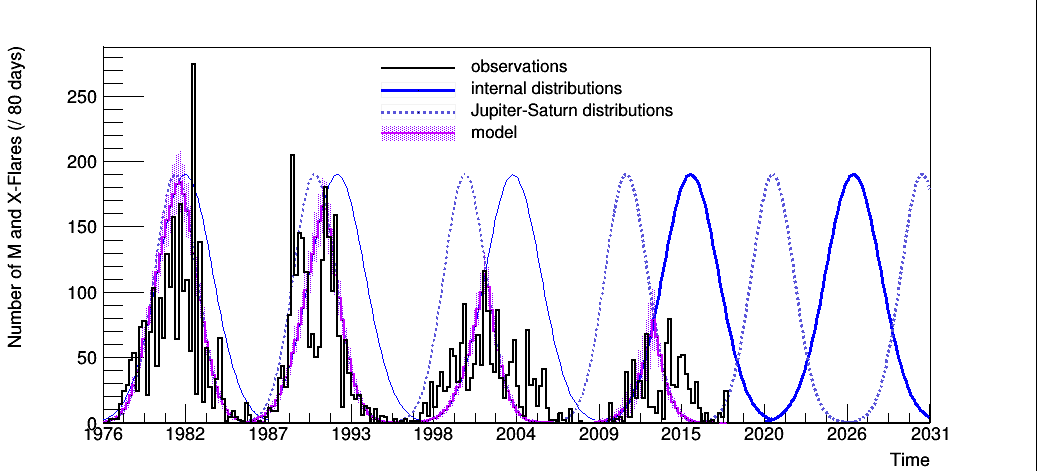
Observations and model predictions for cycles 21-25, including the observations of year 2017. (The time range is shown in years, starting on 1976/06/30. The last three populated bins belong to year 2017, with the next unpopulated bin starting on 2017/11/20.)
WRAP-UP
The proposed phenomenological model provides quantitative deterministic descriptions for the general evolution of individual solar cycles, in terms of energetic flares.
It consists of two components, one corresponding to the "established" period of ~11 years, centered on the temporal middle of each cycle, and one corresponding to the relative motion of Jupiter and Saturn, centered on the dates of their conjunctions.
Both components were extracted from the data of cycle 21 due to the two centering dates lying close. All in all, the only other needed input is the dates of the cycles' middles. Estimating the middles can lead to reasonable approximations and permits extrapolation over the next years.
The synergy of these two components can be thought of as an internal, presumably magnetic, solar mechanism being triggered to activity by the approach of the two giant planets, although no proposals are made so far about the involved coupling mechanism. Actually it is hoped that this work will help in its elucidation, as well as in the forecasting of space weather.
--- Technical remarks
(Please see the article for more details.)Dataset
The model was developed using data since the start of cycle 21 and up to the end of year 2016, in total 6,339 and 491 M and X-class flares, with the two categories corresponding to X-ray brightness of 10-5-10-4 W/m2 and all higher values, respectively. No smoothing is performed other than the binning in 80 days. The start of each cycle is defined by the date of the first M-class fl are erupting from a sunspot of reversed magnetic polarity. The resulting start dates for cycles 21-24 are: 1977/01/31, 1986/10/19, 1997/04/01, 2010/01/19. The end of each cycle is defined by the start of the next one.
Temporal middle of cycle 24
On average, the distance between consecutive Jupiter-Saturn alignments and the cycles' temporal middle increases by 396 days between consecutive cycles (given the synodic half-period average of 3,634 and the sunspot cycle average of 4,030 days). This number was used for estimating the temporal middle for the ongoing cycle 24, with respect to 23.
Systematic uncertainties
Two sources of systematic uncertainty enter the calculations: from the binning choices and from the placement of the internal Gaussian distribution.
The binning uncertainty applies to all cycles, and comes from the bin size choice and the position of the start date of data within the first bin, which modify the short-scale distribution of
flares. The largest of the two effects is calculated at 10.4%.
The uncertainty on the centering of the internal Gaussian applies to cycle 24, and is estimated to be 146 days.
Statistical tests
The Pearson correlation coefficient between the distributions of
flares from observations and from the model has the values 0.73 and 0.88, in the whole range and within 0o to +45o respectively, with p-values smaller than 10-7.
A Kolmogorov-Smirnov test is used to examine whether a satisfactory agreement between the data and the staggered overlapping of the two used Gaussians could arise randomly, or if it is indeed linked to the two planets' synodic period. The testing is done by letting the average time length between consecutive planetary alignments vary between 2,000-5,000 days. The test results in a sharp global minimum at 3,680 days, i.e. 1.3% away from the actual value.
Sunspots
An accurate comparison to the sunspot records is impeded by the absence of modeling for the correspondence between sunspots and
flares, and the significant difference of their
temporal distributions in cycles 21-24.
However, it is perhaps noteworthy that if the model is extended to cover the historical records' range, the only two times where the double overlapping between the two component Gaussians occurs, with the resulting low distributions, are in cycles 6 (Dalton minimum) and 14 (Gleissberg minimum).
---
(This forecast first went up on arXiv in July'19. The first flare of cycle 25 in May 2020 permitted the update of the forecast, shown here. The update doesn't involve any significant change, as the date of the first flare was very close to the previously predicted one.)
The figure below shows the predicted time evolution of solar cycle 25 in terms of counts of flares M1.0+; the prediction is the purple histogram, with the shadowed areas representing statistical and systematic uncertainty. The upper x-axis is the number of days since the beginning of year 2019; each bin spans 80 days.
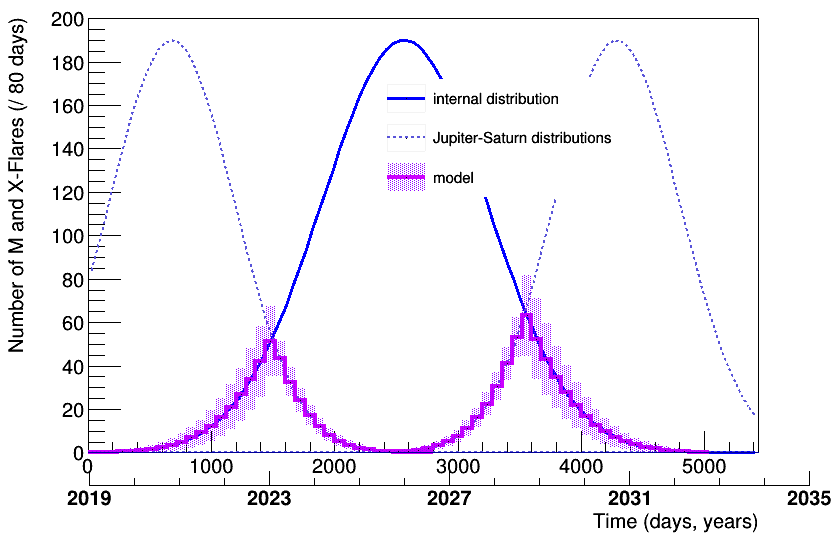
Predicted evolution of cycle 25 in counts of flares (purple).
In addition, this is a list of explicit predictions as resulting from the plot:
Onset: When taking uncertainties into account, the first date with a flare count larger than 1 is found roughly between October 2019 and June 2021. The model curve itself exceeds 1 in late March 2020, so the weeks following it are proposed as the most probable onset window. UPDATE: The first flare of C25 actually appeared on 29th May 2020, compatible to a large extent with the prediction.
Evolution: The general evolution of flares' activity will follow the plotted curve, i.e. it will be rather low, spread out, and marked by two distinct ranges. More specifically it will increase until roughly the beginning of year 2023 and subsequently decrease until a cease around the end of 2025; a distinct second period of activity will follow the cease, following roughly the second part of the plotted curve. (It must be noted that this does not refer to the "double peaks" appearing in some cycles, e.g. C22.)
Amplitude: The maximum amplitude is expected to be 50-60 flares per 80 days, corresponding to the two peaks in the histogram.
Overall intensity: Comparable to that of C24.
Duration: With the currently available data, the start of C26 is placed around the middle of 2031, making C25 roughly 11 years long.
Comparison to historical sunspot minima: In terms of sunspots, C25 will be similar to the two historical "local minima", cycles 6 and 14 (this is the only prediction related to sunspots).